Infection-associated spot detection
Source:vignettes/04_Infection-associated_spot_detection.Rmd
04_Infection-associated_spot_detection.RmdOverview
This vignette describes how to identify infection-associated spots
using STID after preprocessing.
Infection-associated spots can be detected using either gene-level signals or gene-set scores. The gene-level strategy defines positive spots based on the expression of pathogen-derived genes or host-responsive genes, whereas the gene-set strategy defines positive spots based on gene-set scores that quantify the activity of infection-associated pathways or biological processes.
This vignette covers:
- defining pathogen-derived and host-responsive gene sets;
- detecting infection-associated spots using gene-level signals;
- detecting infection-associated spots using gene-set scores;
- visualizing threshold-based detection results and spatial distributions.
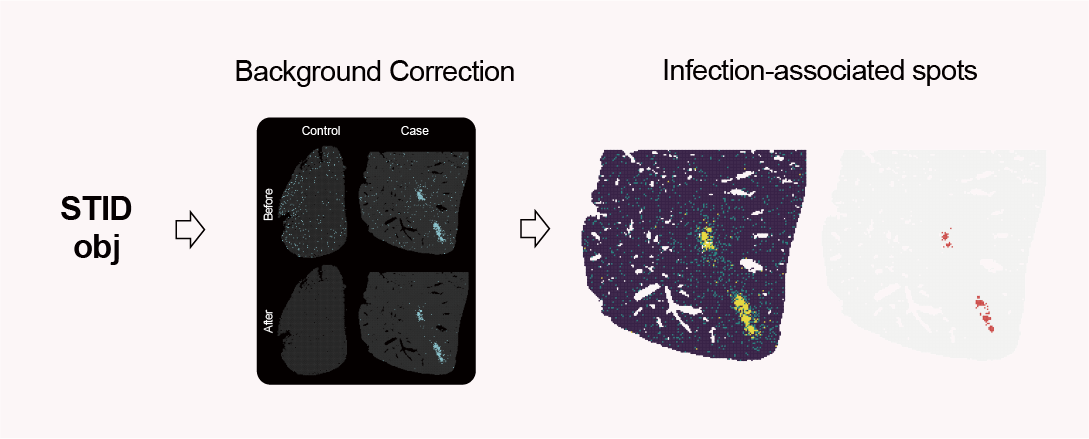
Infection-associated spot detection workflow.
Note: Update the input object name, sample metadata columns, pathogen gene list, host-responsive gene list, gene-set collections, detection thresholds, plotting parameters, output group names, and saved object path according to the dataset used in your analysis.
Reference code: For more runnable code examples, please refer to the article code.
Example data
This vignette uses the African trypanosomiasis, Japanese encephalitis (JE), and AE infection datasets to illustrate the detection of infection-associated spots.
African trypanosomiasis infection model
The stRNA_Tbb data can be downloaded from Figshare. This
is a Visium-based mouse tissue dataset infected with Trypanosoma
brucei brucei.
stRNA <- readRDS(file = "./stRNA_Tbb.rds")
stRNA <- suppressMessages(UpdateSeuratObject(stRNA))
stRNA <- NormalizeData(stRNA)
meta_data <- stRNA@meta.data
table(meta_data$group)
The gene vectors below define pathogen-derived genes and host-responsive genes used for downstream detection.
pathogen_genes <- c("Tb927.7.5940", "Tb927.6.4280")
host_response_genes <- c(
  "Ttr", "Cd138", "Il10", "Il10ra", "Aif1", "Chil3", "Arg1"
)
Note: Replace
pathogen_genesandhost_response_geneswith features relevant to the pathogen, tissue, host species, and biological question under investigation. Confirm that all gene identifiers match the row names of the input Seurat object.
STID_obj <- as.STID(
  stRNA,
  samp_colnm = "group",
  samp_grp_colnm = "group",
  celltype_colnm = NULL,
  host_org = "mouse",
  pathogen_grp = "parasite",
  pathogen_org = "trypanosome",
  pathogen_gene = pathogen_genes,
  data_format = "hex_grid",
  data_platform = "Visium"
)

print(STID_obj)
Note: Update
samp_colnm,samp_grp_colnm,celltype_colnm,host_org,pathogen_grp,pathogen_org,data_format, anddata_platformto match the metadata and spatial platform of the analyzed dataset.
Because a subset of pathogen-derived features in the
stRNA_Tbb example shows atypical signal patterns, this
vignette demonstrates infection-associated spot detection without
applying pathogen background correction to this dataset. For datasets
with suitable background or control samples, pathogen background
correction should be performed before formal infection-associated spot
detection.
JE infection model
The stRNA_JEV data can be downloaded from Figshare. This
is a Stereo-seq-based mouse tissue dataset infected with Japanese
encephalitis virus.
stRNA <- readRDS(file = "./stRNA_JEV.rds")
stRNA <- suppressMessages(UpdateSeuratObject(stRNA))
# stRNA <- NormalizeData(stRNA)
meta_data <- stRNA@meta.data
table(meta_data$new_samp)
The JEV example uses viral genes as pathogen-derived features and selected interferon- and inflammation-associated genes as host-responsive markers.
pathogen_genes <- c(
  "NS5", "C", "NS3", "NS1", "E", "Prm", "NS4aAlt", "NS4bAlt", "NS2a", "NS2b"
)
host_response_genes <- c("Cxcl10", "Ifitm3", "Isg15", "Irf7", "Ccl5", "Ccl2")
STID_obj <- as.STID(
  stRNA,
  samp_colnm = "new_samp",
  samp_grp_colnm = "grp",
  celltype_colnm = "new_cell",
  host_org = "mouse",
  pathogen_grp = "virus",
  pathogen_org = "JEV",
  pathogen_gene = pathogen_genes,
  data_format = "square_grid",
  data_platform = "StereoSeq",
  binsize = 35
)

print(STID_obj)
Because the pathogen in the JE infection model is captured by probes, pathogen genes are not present in the control group, so pathogen background correction is not necessary, and we can proceed directly to infection-associated spot detection.
Detect infection-associated spots using gene-level signals
Gene-level detection identifies positive spots from pathogen-derived gene expression or host-responsive gene expression. For each sample, the expression distribution is evaluated, and a quantile-based threshold is used to classify spots as positive or negative. By default, nonzero expression values can be used to estimate the threshold, and the selected cutoff should be calibrated according to spatial expression patterns and frequency distributions.
For multiple genes, aggregated expression across the selected features is used for spot-level detection. Optional smoothing can be applied before thresholding to reduce local noise.
African trypanosomiasis infection model
Calculate the overall expression of pathogen-derived genes and host-responsive genes and add the results to meta.data.
COLOR_DIS_CON <- STID::COLOR_DIS_CON

# pathogen-derived genes
pathogen_signal <- GetGeneStat(
  STID_obj = STID_obj,
  features = pathogen_genes,
  prefix = "pathogen_gene",
  func = "sum"
)

STID_obj <- AddMetaColumn(
  STID_obj = STID_obj,
  add_data = pathogen_signal,
  meta_key = "raw",
  ignore_rownm = FALSE
)

# host-responsive genes
host_response_signal <- GetGeneStat(
  STID_obj = STID_obj,
  features = host_response_genes,
  prefix = "host_response_gene",
  func = "sum"
)

STID_obj <- AddMetaColumn(
  STID_obj = STID_obj,
  add_data = host_response_signal,
  meta_key = "raw",
  ignore_rownm = FALSE
)
# pathogen-derived genes
pathogen_signal_columns <- grep(
  "pathogen_gene",
  colnames(STID_obj@meta.data),
  value = TRUE
)

STID_obj <- SpotDetect_Gene(
  STID_obj,
  features = pathogen_genes,
  feature_colnm = pathogen_signal_columns,
  PosThres_prob = 0,
  PosThres_count = 2,
  col = COLOR_DIS_CON,
  black_bg = FALSE,
  pt_size = 2.2,
  vmax = "p99",
  blur_method = NULL,
  blur_n = 1.5,
  blur_sigma = 0.5,
  plot_method = "single",
  grp_nm = "Tbb_pathogen_gene_signal_white"
)

# host-responsive genes
host_response_signal_columns <- grep(
  "host_response_gene",
  colnames(STID_obj@meta.data),
  value = TRUE
)

STID_obj <- SpotDetect_Gene(
  STID_obj,
  features = host_response_genes,
  feature_colnm = host_response_signal_columns,
  PosThres_prob = 0,
  PosThres_count = 2,
  col = COLOR_DIS_CON,
  black_bg = FALSE,
  pt_size = 2.2,
  blur_method = NULL,
  blur_n = 1,
  blur_sigma = 0.5,
  plot_method = "single",
  grp_nm = "Tbb_host_response_gene_signal_white"
)
The following figure summarizes threshold-based classification of infection-associated spots using gene-level signals.
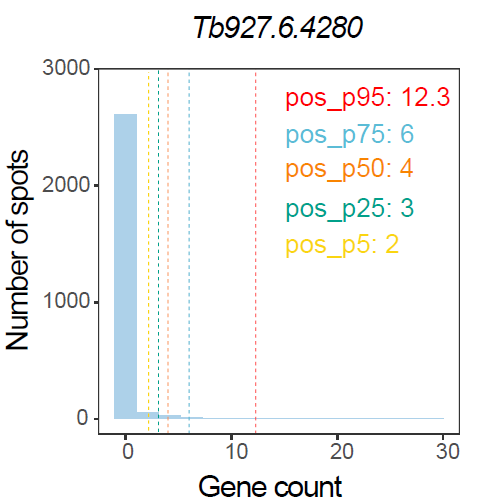
Threshold-based classification of infection-associated spots using gene-level signals.
JE infection model
COLOR_DIS_CON <- STID::COLOR_DIS_CON

pathogen_signal <- GetGeneStat(
  STID_obj = STID_obj,
  features = pathogen_genes,
  prefix = "all_gene",
  func = "sum"
)

STID_obj <- AddMetaColumn(
  STID_obj = STID_obj,
  add_data = pathogen_signal,
  meta_key = "raw",
  ignore_rownm = FALSE
)

host_response_signal <- GetGeneStat(
  STID_obj = STID_obj,
  features = host_response_genes,
  prefix = "host_response_gene",
  func = "sum"
)

STID_obj <- AddMetaColumn(
  STID_obj = STID_obj,
  add_data = host_response_signal,
  meta_key = "raw",
  ignore_rownm = FALSE
)

pathogen_signal_columns <- grep(
  "all_gene",
  colnames(STID_obj@meta.data),
  value = TRUE
)

host_response_signal_columns <- grep(
  "host_response_gene",
  colnames(STID_obj@meta.data),
  value = TRUE
)

STID_obj <- SpotDetect_Gene(
  STID_obj = STID_obj,
  features = pathogen_genes,
  feature_colnm = pathogen_signal_columns,
  PosThres_prob = 0,
  PosThres_count = 1,
  col = COLOR_DIS_CON,
  black_bg = FALSE,
  pt_size = 0.25,
  blur_method = NULL,
  blur_n = 1,
  blur_sigma = 0.5,
  plot_method = "single",
  grp_nm = "JEV_multisamp_all_gene_white"
)

STID_obj <- SpotDetect_Gene(
  STID_obj = STID_obj,
  features = host_response_genes,
  feature_colnm = host_response_signal_columns,
  PosThres_prob = 0,
  PosThres_count = 4,
  col = COLOR_DIS_CON,
  black_bg = FALSE,
  pt_size = 0.25,
  blur_method = NULL,
  blur_n = 1,
  blur_sigma = 0.5,
  plot_method = "single",
  grp_nm = "JEV_multisamp_host_gene_white"
)
AE infection model
# high_exp_genes is defined in the pathogen background correction vignette
STID_obj_after <- SpotDetect_Gene(
  STID_obj_after,
  features = high_exp_genes,
  feature_colnm = grep(
    "all_gene",
    colnames(STID_obj_after@meta.data),
    value = TRUE
  ),
  PosThres_prob = 0,
  PosThres_count = 3,
  col = COLOR_DIS_CON,
  black_bg = FALSE,
  pt_size = 1,
  # blur_method = "isoblur",
  blur_method = NULL,
  blur_n = 1,
  blur_sigma = 0.5,
  plot_method = "single",
  grp_nm = "AE_correct_after_all_gene_white"
)

STID_obj_after <- SpotDetect_Gene(
  STID_obj_after,
  features = NULL,
  PosThres_prob = 0,
  PosThres_count = 3,
  col = COLOR_DIS_CON,
  black_bg = FALSE,
  pt_size = 1,
  blur_method = NULL,
  blur_n = 1,
  blur_sigma = 0.5,
  plot_method = "single",
  grp_nm = "AE_correct_after_host_gene_white"
)
Detect infection-associated spots using gene-set scores
Gene-set score-based detection identifies spatial locations with
elevated activity of predefined biological programs. STID
supports algorithm-based scoring methods, such as
AddModuleScore, AUCell, and
UCell, as well as expression-based summary metrics such as
mean or total expression.
The same thresholding strategy used for gene-level detection can be applied to gene-set scores. Spots with scores above the selected threshold are classified as positive.
African trypanosomiasis infection model
Gene_Geneset <- STID::Gene_Geneset

pcd_geneset_df <- Gene_Geneset$Mouse$Geneset$Mouse_PCD_geneset
pcd_geneset_list <- lapply(pcd_geneset_df, na.omit)
names(pcd_geneset_list)

STID_obj <- SpotDetect_Geneset(
  STID_obj,
  geneset_list = pcd_geneset_list,
  score_method = "AddModuleScore",
  n_iter = 5,
  nbin = 24,
  seed = 10,
  PosThres_prob = 0,
  PosThres_score = 7.5,
  pt_size = 2.2,
  col = COLOR_DIS_CON,
  black_bg = FALSE,
  blur_method = NULL,
  plot_method = "single",
  grp_nm = "Tbb_PCD_geneset_white"
)
parasite_response_geneset_df <- Gene_Geneset$Mouse$Geneset$KEGG$Mouse_KEGG_Detect_parasitic_geneset
parasite_response_geneset_list <- lapply(parasite_response_geneset_df, na.omit)
names(parasite_response_geneset_list)

STID_obj <- SpotDetect_Geneset(
  STID_obj,
  geneset_list = parasite_response_geneset_list,
  score_method = "AddModuleScore",
  n_iter = 5,
  nbin = 24,
  PosThres_prob = 0,
  PosThres_score = 1.75,
  pt_size = 2.2,
  col = COLOR_DIS_CON,
  black_bg = FALSE,
  blur_method = NULL,
  plot_method = "single",
  grp_nm = "Tbb_parasite_response_geneset_white"
)
The following figure shows the spatial distribution of infection-associated spots identified using gene-set scores.
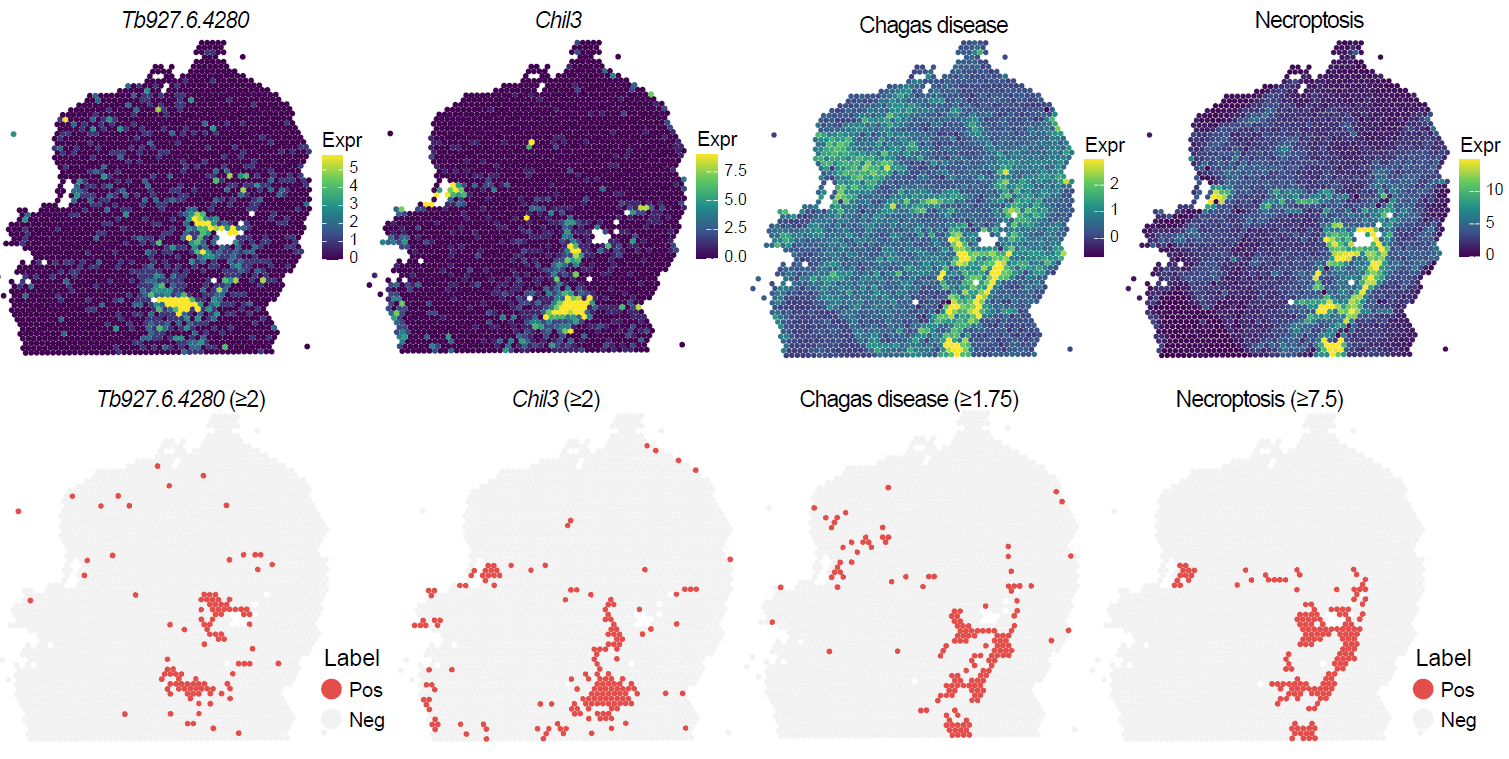
Spatial distribution of infection-associated spots identified using gene-set scores.
JE infection model
Gene_Geneset <- STID::Gene_Geneset

pcd_geneset_df <- Gene_Geneset$Mouse$Geneset$Mouse_PCD_geneset
pcd_geneset_list <- lapply(pcd_geneset_df, function(x) na.omit(x))

STID_obj <- SpotDetect_Geneset(
  STID_obj = STID_obj,
  geneset_list = pcd_geneset_list,
  score_method = "AddModuleScore",
  n_iter = 5,
  nbin = 24,
  seed = 10,
  PosThres_prob = 0.75,
  PosThres_score = 0,
  pt_size = 0.25,
  col = COLOR_DIS_CON,
  black_bg = FALSE,
  blur_method = NULL,
  plot_method = "single",
  grp_nm = "JEV_multisamp_PCD_white"
)

viral_response_geneset_df <- Gene_Geneset$Mouse$Geneset$Mouse_GO_BP_Detect_viral_geneset
colnames(viral_response_geneset_df) <- gsub(
  "GOBP_",
  "",
  colnames(viral_response_geneset_df)
)
viral_response_geneset_list <- lapply(viral_response_geneset_df, function(x) na.omit(x))

STID_obj <- SpotDetect_Geneset(
  STID_obj = STID_obj,
  geneset_list = viral_response_geneset_list,
  score_method = "AddModuleScore",
  n_iter = 5,
  nbin = 24,
  PosThres_prob = 0.75,
  PosThres_score = 0,
  pt_size = 0.25,
  col = COLOR_DIS_CON,
  black_bg = FALSE,
  blur_method = NULL,
  plot_method = "single",
  grp_nm = "JEV_multisamp_GO_viral_white"
)
The following figure shows the spatial distribution of infection-associated spots identified using gene-set scores.
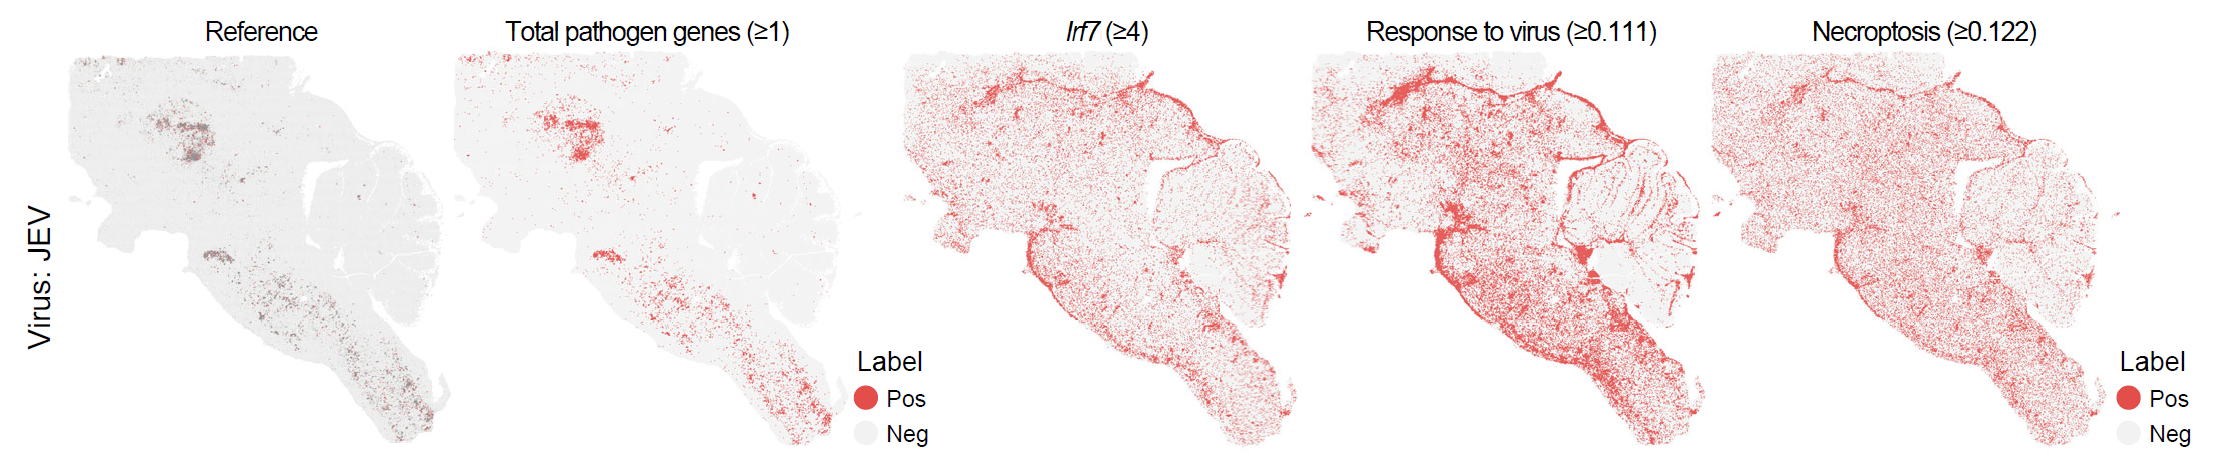
Spatial distribution of infection-associated spots identified using gene-set scores.
AE infection model
geneset_df <- STID::Gene_Geneset$Mouse$Geneset$Mouse_PCD_geneset
geneset_list <- lapply(geneset_df, function(x) na.omit(x))

STID_obj_after <- SpotDetect_Geneset(
  STID_obj_after,
  geneset_list = geneset_list,
  score_method = "AddModuleScore",
  n_iter = 5,
  nbin = 24,
  PosThres_prob = 0.25,
  PosThres_score = 0,
  pt_size = 1,
  col = COLOR_DIS_CON,
  black_bg = FALSE,
  blur_method = NULL,
  plot_method = "single",
  grp_nm = "AE_correct_after_PCD_white"
)

geneset_df <- STID::Gene_Geneset$Mouse$Geneset$Mouse_KEGG_Detect_parasitic_geneset
geneset_list <- lapply(geneset_df, function(x) na.omit(x))

STID_obj_after <- SpotDetect_Geneset(
  STID_obj_after,
  geneset_list = geneset_list,
  score_method = "AddModuleScore",
  n_iter = 5,
  nbin = 24,
  PosThres_prob = 0.25,
  PosThres_score = 0,
  pt_size = 1,
  col = COLOR_DIS_CON,
  black_bg = FALSE,
  blur_method = NULL,
  plot_method = "single",
  grp_nm = "AE_correct_after_KEGG_Parasite_white"
)
The following figure shows the spatial distribution of infection-associated spots identified using gene-set scores.
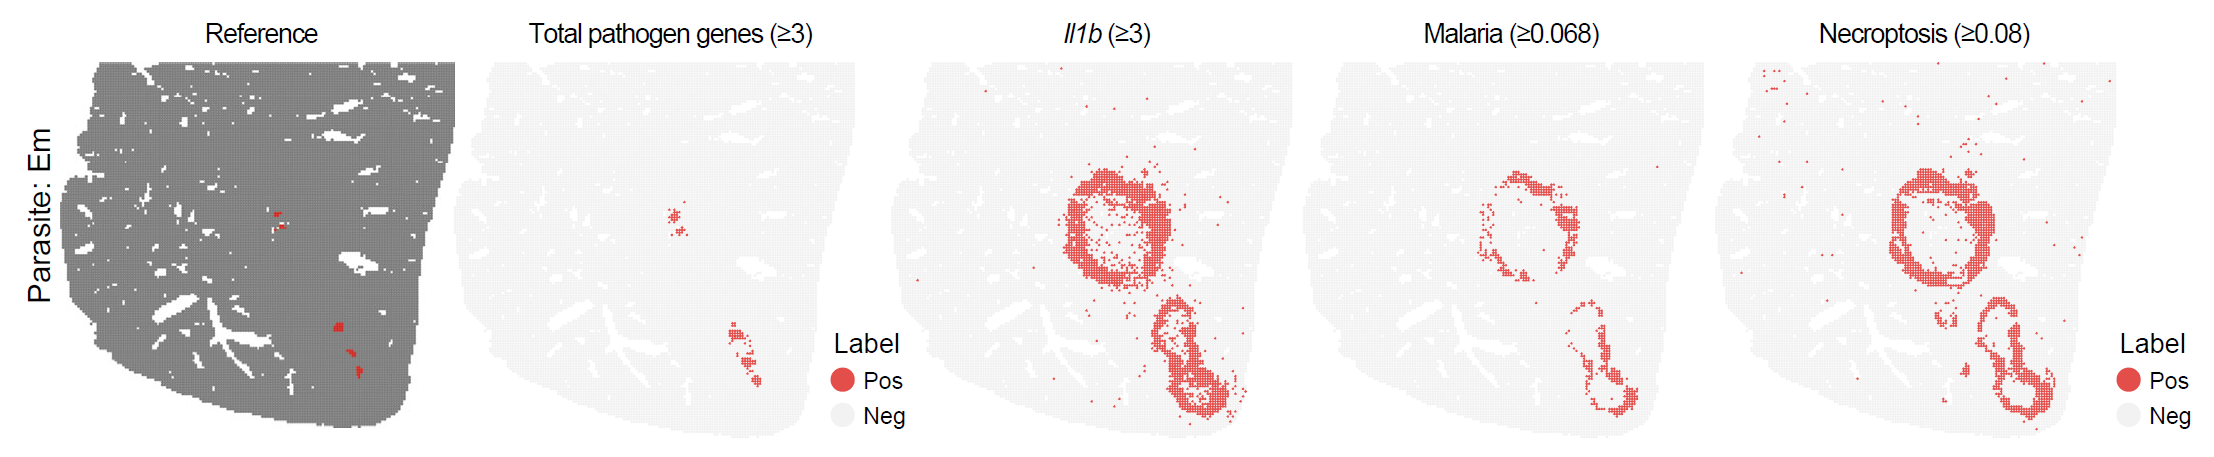
Spatial distribution of infection-associated spots identified using gene-set scores.
Notes
- Perform pathogen background correction before infection-associated spot detection when suitable background or control samples are available.
- Confirm that pathogen-derived genes, host-responsive genes, and gene-set features are present in the input object before running detection.
- Calibrate
PosThres_prob,PosThres_count, andPosThres_scoreaccording to the observed signal distribution, sequencing depth, expected pathogen burden, and tissue-specific background level. - Review spatial maps and threshold summaries together to avoid interpreting isolated low-signal spots as infection-associated regions.
Next steps
This vignette identified infection-associated spots, including pathogen-infected spots and/or host-responsive spots. In the next vignette, we will use these spot-level labels as input to identify infection-associated niches with Foci, Aggregated, or Dispersed mode.
Session information
sessionInfo()
#> R version 4.2.0 (2022-04-22 ucrt)
#> Platform: x86_64-w64-mingw32/x64 (64-bit)
#> Running under: Windows 10 x64 (build 22000)
#>
#> Matrix products: default
#>
#> locale:
#> [1] LC_COLLATE=Chinese (Simplified)_China.utf8
#> [2] LC_CTYPE=Chinese (Simplified)_China.utf8
#> [3] LC_MONETARY=Chinese (Simplified)_China.utf8
#> [4] LC_NUMERIC=C
#> [5] LC_TIME=Chinese (Simplified)_China.utf8
#>
#> attached base packages:
#> [1] stats     graphics  grDevices utils     datasets  methods   base
#>
#> loaded via a namespace (and not attached):
#>  [1] digest_0.6.35     R6_2.6.1          jsonlite_1.8.8    lifecycle_1.0.5
#>  [5] evaluate_1.0.1    cachem_1.1.0      rlang_1.1.7       cli_3.6.5
#>  [9] rstudioapi_0.15.0 fs_1.6.3          jquerylib_0.1.4   bslib_0.8.0
#> [13] ragg_1.3.0        rmarkdown_2.29    pkgdown_2.2.0     textshaping_0.3.6
#> [17] desc_1.4.3        tools_4.2.0       htmlwidgets_1.6.4 yaml_2.3.10
#> [21] xfun_0.49         fastmap_1.2.0     compiler_4.2.0    systemfonts_1.0.4
#> [25] htmltools_0.5.8.1 knitr_1.49        sass_0.4.9